
Note: The t1.micro instance type has been superseded by the t2 family, which are much better suited for general use. I ran some tests on the t2 family as well.
Amazon t1.micro instances are the most affordable EC2 instance types. Their distinctive feature is that while allowing short bursts of high CPU power (around double that of a m1.small instance), but very soon throttle the CPU usage significantly. Therefore they are well suited for uses where there is low constant load, but periodic bursts of high activity, such as web servers for low-volume sites.
However, Amazon does not provide any specification on the exact method of throttling nor how long you can use full CPU utilization before the VM throttles. I couldn’t find any info on this elsewhere, so I did some testing myself.
Update: I ran the tests longer, and it seems that the amount of CPU time given to a particular instance does not depend on the weekday, time of day or other load.
I wrote a short program that generates a desired amount of CPU load and measures the amount of CPU time it receives (in generic units). I ran it on a 64-bit micro instance running Ubuntu Linux in the EU Ireland region for 10 minutes at varying CPU utilization, idling for 10 minutes between each test. Below are graphs on the allotted CPU time for various load levels.
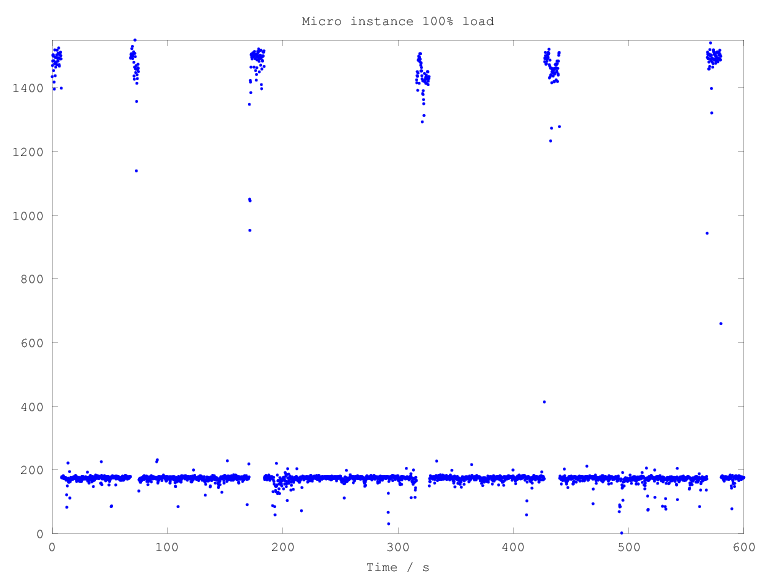
Micro instance 100% load
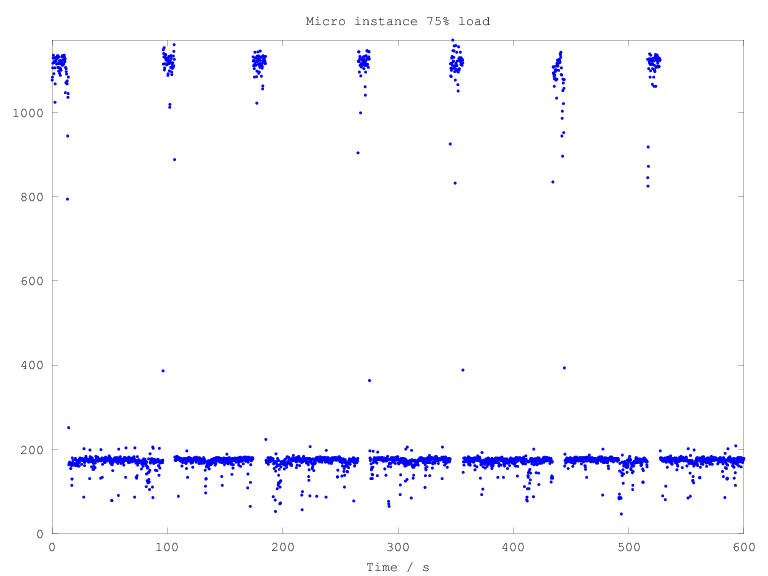
Micro instance 75% load

Micro instance 50% load
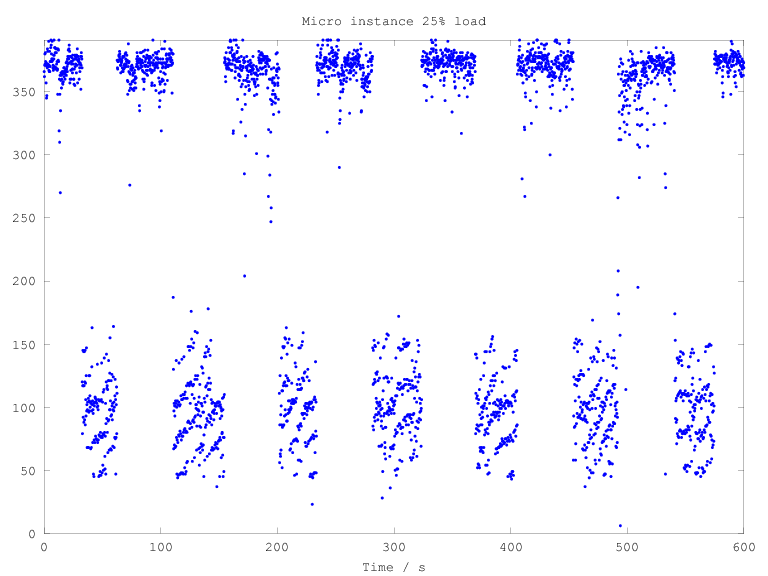
Micro instance 25% load
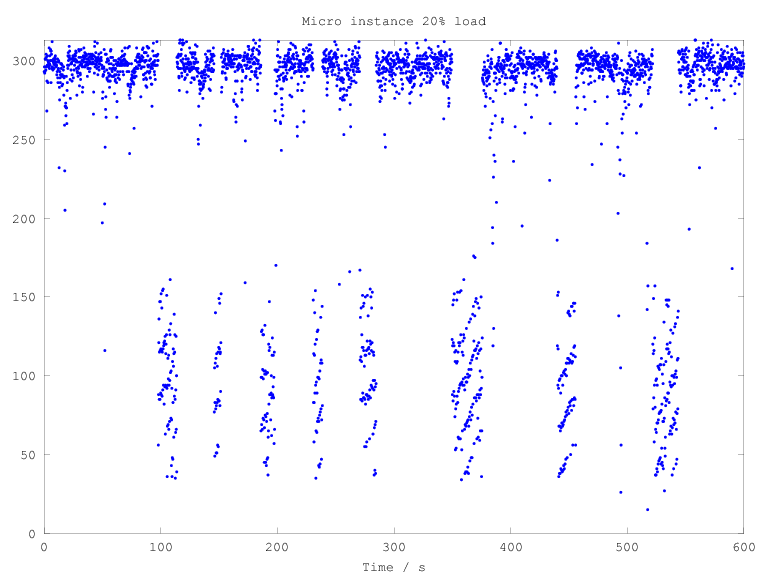
Micro instance 20% load
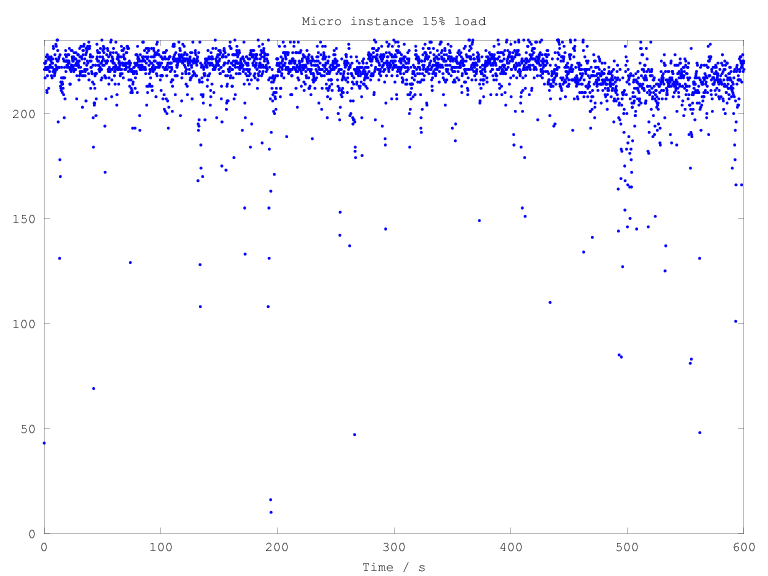
Micro instance 15% load
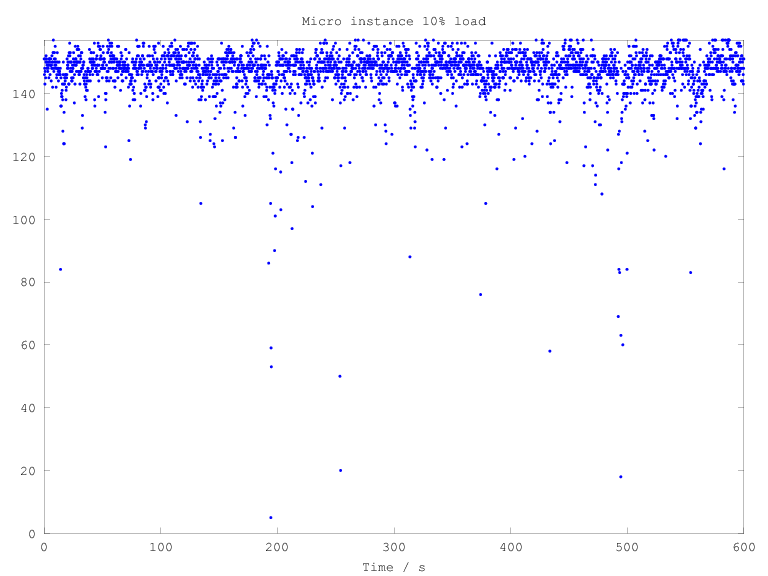
Micro instance 10% load
Full load throttling
One interesting question is how the throttling performs when the CPU is fully utilized, which may occur for example during a system upgrade.
In this case the throttling is rather binary; the VM either allows using the entire CPU, or throttles to about 11% of the full capacity. You get about 10-13 seconds of full CPU power every 2-2.5 minutes, though this duty cycle varies somewhat.
Constant load level

Micro instance 10% / 15% / 20% load
Another interesting matter is how much constant load you can provide a micro instance without it throttling. This plot shows the results for 10%, 15% and 20% load levels. From this it’s evident that the 20% load already throttles occasionally, but 15% load does not seem to have significant throttling.
Therefore if your micro instance web server’s load is going above 15%, you’re in a danger zone. Once the throttling starts, response times will spike and requests may start piling up.
This limit is also evident when summing up the total CPU time obtained during the 10 minute tests. From 20% load to 100% load the program got approximately the same amount of CPU time during the test, but for 10% and 15% it utilized less processing time than was available from the VM.
Another result of this is that if you have to do long processing on a micro instance, it’s approximately the same whether you hog up all the CPU you get, or slow down the processing yourself.
Conclusions
Micro instances are well suited for uses where there is little constant load. A constant load level of 15% can be sustained indefinitely without CPU throttling. However, it’s good to remember that if you’re constantly using all of your allotted CPU time, you may be throttled very quickly in CPU-intensive bursts.
During throttling, the available CPU is between 10-50% of the normal peak power. The higher the load, the more aggressive the throttling. With full load, you only get full power for about 10 seconds every 2 minutes, and 11% CPU time otherwise.
For long CPU-intensive tasks (lasting several minutes) it doesn’t matter whether you use all the CPU you get or regulate it, the task will take as long to finish anyhow.
Longer-running tests showed that a specific instance was allocated approximately the same amount of CPU time regardless of the time of day or weekday. This means that the load of other micro instances running on the same hardware shouldn’t adversely affect your performance.
Keep in mind, these are results for a single micro instance type in a single region. Amazon doesn’t specify that the rules are the same everywhere, and they may even change without notice. YMMV.

At least in year 2012, operations like ‘yum update’, logwatch with logrotate in cron, etc. were enough to push CPU load into throttling in t1.micro (using Amazon Linux AMI instance as a web server).
What did you use to draw that neat graphs? I am using your methodology (and code 🙂 ) because I am trying to figure out how micro instances behave.
The graphs are made using octave and gnuplot.
Pingback: Benchmarking AWS t2 instances | Code for Hire